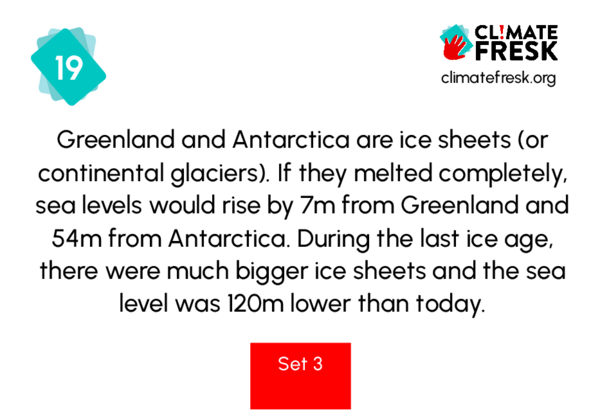
19 - Melting Ice Sheets
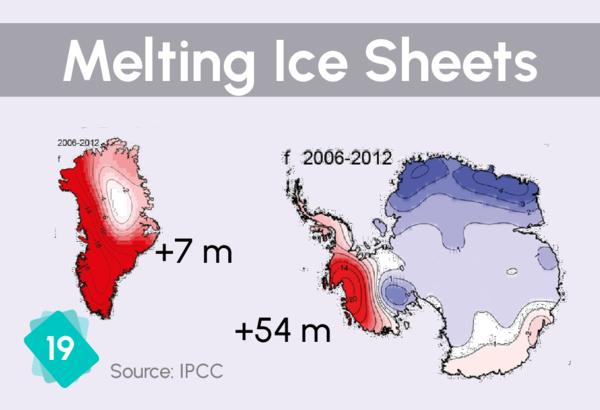
These illustrations represent the gain or loss of mass of the caps, indicated in centimetres of water per year (cm of water/year) and measured gravimetrically. In blue the mass gain (because it snows more) and in red the losses (glaciers flow faster towards the ocean).
Earth from Space
Copernicus Sentinel-2 image of melt ponds in the province of Avannaata in West Greenland. Greenland’s meltwater runoff has risen by 21% over the past 40 years. The research also shows that between 2011 and 2020, meltwater runoff from Greenland raised the global sea level by one centimetre. Worryingly, one third of this total was produced in just two separate years, in 2012 and 2019 – two hot summers when extreme weather led to record-breaking levels of ice melting not seen in the past 40 years. Scientists found that major sea-level rise from the melting of the Greenland ice cap is now ‘inevitable’ even if the burning of fossil fuels were to halt overnight. Using satellite observations of Greenland ice loss and ice cap from 2000 to 2019, the team found the losses will lead to a minimum rise of 27 cm regardless of future greenhouse gases emissions.
Credits :© ESA/Copernicus Sentinel data - 2022


